Product strategy and funding
Developed the roadmap, gained project support and funding, led teams, defined acceptance criteria, and moved the product from prototype to production.
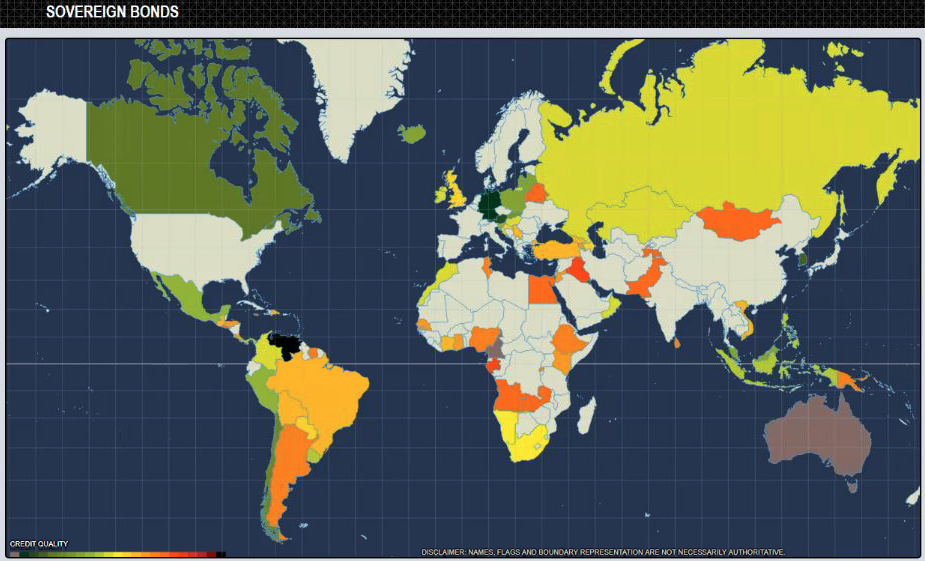
At DTCC, I led product development of interactive risk maps and wrote the JavaScript and D3 front end and the supporting APIs personally. The maps helped executive management analyze member holdings by geography and bond credit ratings, and connected severe-weather threats to business-continuity exposure.
The work combined product strategy, open-source technology approval, data analysis, geographic visualization, executive communication, and production delivery.
Developed the roadmap, gained project support and funding, led teams, defined acceptance criteria, and moved the product from prototype to production.
Built the interactive front end in JavaScript and D3 and wrote the APIs behind it, after researching and gaining approval to bring free and open-source visualization software into a regulated environment.
Applied text analytics, phonetic algorithms, and geolocation to connect large financial datasets to county, country, and regional risk views.
Integrated live severe-weather information to correlate potential events with client locations and support business-continuity decisions.
Two of the interactive geographic views developed for Risk Maps.
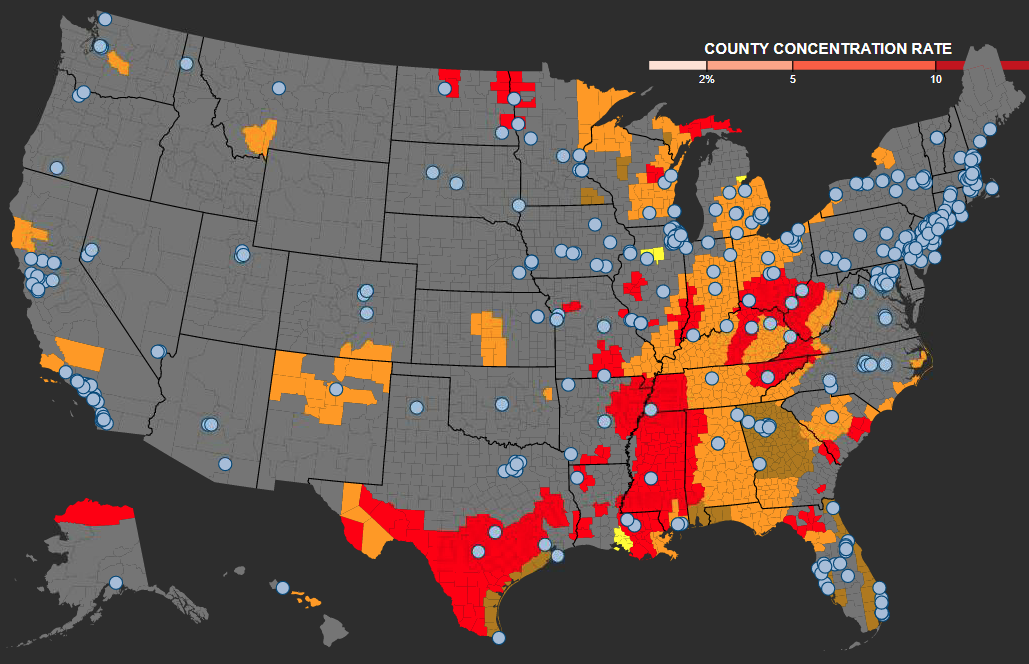
I presented an internal TED-style talk on the impact of natural disasters and extreme weather on the financial industry. The presentation used Hurricane Harvey as the case study and included a live Risk Maps demonstration.
The goal was not to show a map. It was to make the risk visible early enough for leaders and clients to act.
The climate maps projected National Weather Service alerts on a county-level U.S. map and correlated them with client locations. They were used during Hurricanes Harvey and Irma to support communication with clients in projected storm paths and help confirm that business-continuity plans were in place.
Selected 95-second presentation excerpt
In this internal TED-style presentation, I showed how live weather alerts and location data could help identify organizations in a storm's path early enough to protect business continuity and reduce disruption to financial markets.
The excerpt shows the weather visualization, the executive request that led to its operational use, and how the information supported proactive outreach before a major storm.